Mutual Fund Types in India: Equity, Index, Debt, Hybrid and Arbitrage
Equity, index, debt, balanced advantage and arbitrage funds in India: what each holds, how it is taxed, its risks and which suits your time horizon.
Equity, index, debt, balanced advantage and arbitrage funds are all mutual funds, but they own different things, earn their returns in different ways and are taxed differently. The same label covers a small-cap fund that can fall 50% or more in a downturn and an arbitrage fund where capital loss over a few months is uncommon.
Choosing between them comes down to a few questions: how much fall you can sit through without selling, when you will need the money, whether an active manager's skill justifies the extra cost, and how much of the return you keep after tax.
How mutual funds are grouped
In India, fund categories are not vague labels. SEBI defines equity categories precisely by market capitalisation rank, and debt funds come in categories defined by what they hold and the maturity of those holdings. Either way, the category determines the risk: the label tells you the risk character of a fund before you read a single page of its factsheet.
Three distinctions do most of the work:
- What the fund owns. Equity funds own shares of companies. Debt funds lend money by buying fixed-income securities, which makes them fundamentally different from equity funds and from FDs, which pay a contractually fixed rate. Hybrid funds hold both: a plain balanced or aggressive hybrid fund keeps a roughly fixed equity-debt ratio, while a balanced advantage fund moves it. An arbitrage fund holds shares alongside matching futures positions, so it is fully hedged.
- How it is managed. An index fund tracks an index; an actively managed fund charges more for a manager who tries to beat it.
- How it is taxed. A fund that keeps enough of its assets in domestic equities is treated as equity-oriented for tax, and balanced advantage and arbitrage funds are usually structured to qualify even though part of their money carries debt-like risk. Gains on debt funds bought on or after 1 April 2023 are taxed at your income slab rate.
Equity funds by market cap: large, mid and small cap
Large-cap, mid-cap and small-cap describe one simple thing — the size of the companies a fund invests in. That single variable drives how much the fund can grow, how violently it can fall, and how long it takes to recover. Choose a mix that is too aggressive and you'll panic-sell in the first crash; choose one too conservative and you'll quietly under-build your wealth over decades.
How SEBI defines the market-cap categories
Market capitalisation is a company's share price multiplied by its number of shares: the total market value of the business. SEBI ranks every listed company by full market cap and draws hard lines:
| Category | Definition | Minimum allocation rule |
|---|---|---|
| Large-cap | Top 100 companies by market cap | Fund must hold ≥80% in large-caps |
| Mid-cap | 101st to 250th company | Fund must hold ≥65% in mid-caps |
| Small-cap | 251st company onwards | Fund must hold ≥65% in small-caps |
A small-cap fund must keep at least 65% in companies ranked 251 and below, of which there are thousands. The ranking is reviewed periodically, so a fast-growing mid-cap can graduate to large-cap, and a struggling large-cap can slip down.
How large, mid and small caps behave
In equity, higher return potential comes with higher volatility, and market cap is the cleanest expression of that trade-off.
- Large-caps are India's biggest, most established businesses — household names with deep balance sheets, stable cash flows and analyst coverage. They grow more slowly than smaller companies. Foreign and institutional money flows here first, giving them liquidity and relative stability.
- Mid-caps are companies in a growth phase — past the fragile startup stage, not yet giants. They can compound faster than large-caps as they scale and sharply outperform in good years, but they are more sensitive to economic cycles and sentiment.
- Small-caps are thousands of smaller, less-researched businesses, some of which become tomorrow's mid and large-caps, many of which don't. The winners can multiply many times over, but the category as a whole can crash 50% or more in a downturn and take years to claw back. Liquidity is thinner, so falls can be brutal and fast.
| Category | Typical behaviour in a sharp downturn | Recovery |
|---|---|---|
| Large-cap | Falls, but least among the three | Recovers first |
| Mid-cap | Falls more than large-cap | Recovers after large-caps |
| Small-cap | Falls the most, often dramatically | Slowest, can take years |
These are tendencies, not laws, but they hold often enough to plan around. Small and mid-caps have often delivered higher returns than large-caps over long bull phases, but that is not guaranteed to repeat. The number that should guide you is not "how much can I make" but "how much fall can I sit through without selling."
The category sets the risk, not the quality: each category has well-run and poorly-run funds, and fund quality and cost still matter within it.
How the categories move through a market cycle
The three categories take turns leading. Early in a bull market, after a correction, large-caps usually recover first, because cautious institutional money returns to liquid, resilient stocks while confidence is fragile. As the bull market matures, money rotates into mid and then small-caps; small-cap returns look spectacular and multi-bagger stories fill the financial media just as small-caps become expensive and crowded. Near the top and into a downturn, the order reverses: small-caps fall first and hardest, because thin liquidity means sellers can't find buyers without slashing prices, mid-caps follow, and large-caps fall least and stabilise soonest.
The uncomfortable lesson is that small-caps feel safest after a long run-up, when they are often riskiest, and feel most dangerous deep in a crash, when forward returns are often best. A category can lead for a couple of years and then trail badly for the next several, so switching into whatever cap segment topped the charts last year is one of the most reliable ways to buy high and sell low. A fixed, rule-based allocation that you rebalance mechanically tends to beat chasing the leader, because you trim what has run up and add to what has fallen — the opposite of what most investors do emotionally.
Predicting which cap will lead next year is something even professionals get wrong consistently. Judge a category across a full market cycle, not a recent purple patch, and let a diversified mix or a flexi-cap fund handle the rotation while you focus on what actually drives your outcome: continuing to invest through every phase of the cycle.
Flexi-cap funds and combining categories
Flexi-cap funds can invest across all three categories with no fixed constraint. A good flexi-cap manager shifts the mix based on where they see opportunity and risk — tilting to large-caps when small-caps look frothy, and vice versa. For someone who wants one diversified equity fund, a flexi-cap is often enough.
A large-cap index fund as the core, with a smaller satellite allocation, is another clean approach. The index fund gives you the steady, low-cost backbone — index funds win largely on cost and consistency — while the satellite adds growth potential in a controlled dose. Sizing the two is covered under building the equity part of a portfolio.
Holding separate large, mid and small-cap funds gives you control over the mix but adds complexity and overlap. The basics of choosing a fund apply here: fewer, well-chosen funds beat a sprawling collection.
A worked example: a 15-year equity mix
Suppose you can invest ₹20,000 a month for a long-term goal 15 years away, and you have a moderate-to-high risk appetite. This is not a first portfolio: a beginner is usually better served starting with a large-cap, flexi-cap or index fund and adding small-caps later, in small doses.
| Allocation | Monthly amount | Role |
|---|---|---|
| Large-cap / index fund (50%) | ₹10,000 | Stable core, shallower drawdowns |
| Flexi-cap or mid-cap (30%) | ₹6,000 | Growth engine, moderate volatility |
| Small-cap (20%) | ₹4,000 | High growth potential, highest volatility |
Now picture a crash where the broad market falls 35%. Your large-cap slice might be down ~30%, your mid-cap slice ~40%, and your small-cap slice ~50%. The investor who panics and sells here locks in the worst of it. The investor who keeps the SIP running is buying small-cap units at half price — and over a 15-year horizon, that discipline is usually rewarded.
To see how different return assumptions compound, run each sleeve separately through the SIP calculator — a more conservative return on the large-cap portion, a higher (but far from guaranteed) one on the small-cap portion — and sum the results. Mapping these amounts to an actual target is what the financial goals framework is for. The mix itself is asset allocation within equity: once you've decided how much of your total portfolio is in equity at all, this is how you split that equity across company sizes.
Index funds vs actively managed funds
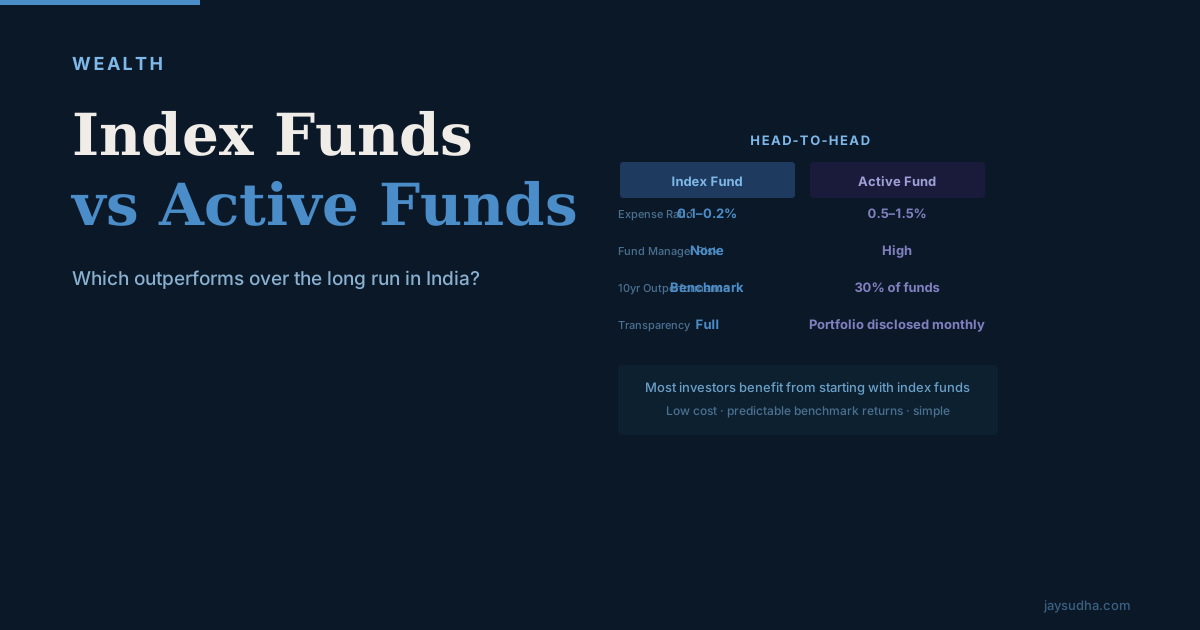
An index fund is a mutual fund that does not try to pick stocks. It holds all (or a representative sample of) the stocks in a specific index, in the same proportion that index dictates: a Nifty 50 index fund holds all 50 companies in the Nifty 50, weighted as the index weights them. Active mutual funds do the opposite. A fund manager and their team research companies, form views on valuations and growth prospects, and construct a portfolio they believe will outperform the benchmark — and they charge more for this effort. The central question is whether the manager's skill justifies that additional cost.
What the SPIVA data shows
SPIVA (S&P Indices Versus Active) produces a regular report comparing active fund performance against benchmarks in India. According to SPIVA India reports (published periodically, latest available on the SPIVA website), roughly 60-70% of large-cap active funds have underperformed their benchmark over 5-year periods, and over 10-year periods the underperformance rate often rises to 70-80%.
The arithmetic is straightforward, and not unique to India: active managers collectively own the market, so before costs their average return equals the index; after costs (expense ratios, transaction costs, tax drag from higher turnover), the average active manager must underperform. Some managers beat the index over some periods, but evidence that any particular manager will keep outperforming is weak, and active funds dominating a short-term window is exactly what you'd expect from random variation.
Survivorship bias. A 10-year track record shows only the funds that survived 10 years. Funds that did poorly were merged, closed or renamed, so the published historical returns for active funds are systematically biased upward. When SPIVA accounts for this by including dead funds, the underperformance rate of active managers increases. When an AMC markets a fund's 10-year SIP return to you, it is showing you a survivor; ten years ago, you would have been choosing from the full universe.
How expense ratios compound
Costs are where index funds have an unambiguous, quantifiable advantage. A typical direct-plan Nifty 50 index fund in India has a total expense ratio (TER) of about 0.1% to 0.2% per year. A typical actively managed large-cap fund might have a TER of 0.7% to 1.5% in direct plan, and 1.5% to 2.5% in regular plan.
Illustrative example — ₹10 lakh invested, 12% gross return (before fees):
| Fund Type | Annual TER | Effective Annual Return | Value After 20 Years |
|---|---|---|---|
| Index Fund (direct) | 0.15% | 11.85% | ₹93.9 lakh |
| Active Fund (direct) | 1.50% | 10.50% | ₹73.7 lakh |
| Active Fund (regular) | 2.00% | 10.00% | ₹67.3 lakh |
The gap between the index fund and the regular-plan active fund is about ₹26.6 lakh on a ₹10 lakh investment over 20 years — entirely from fees, assuming identical gross returns. The active fund would need to consistently outperform the index by 1.5-2% a year just to break even after fees. Very few active funds clear that bar over 20-year periods.
When active funds can still make sense
The efficient market hypothesis is a spectrum, not a binary. Larger markets with more institutional participants and extensive analyst coverage tend to be more efficient — which is why passive investing dominates in US large-caps. Smaller, less-covered segments may offer more opportunities for skilled active managers.
There is a reasonable argument that Indian mid-cap and small-cap companies are less efficiently priced than Nifty 50 constituents: analyst coverage is thinner, information asymmetry is higher, and liquidity constraints mean large institutional investors are sometimes structurally limited. A larger proportion of active mid-cap funds have historically outperformed mid-cap indices compared to large-cap funds. That is not a guarantee, and it still requires identifying funds and managers who will outperform prospectively, but the theoretical case is stronger. The bar for selecting such a fund should be high: a long track record (10+ years including a full market cycle), consistent risk-adjusted returns, stable fund manager tenure, and low turnover.
Fund manager tenure. A track record only means something if the manager who built it is still in charge. Indian fund houses have seen significant fund manager movement over the last decade, and a fund with a 10-year track record may have had 2–3 different managers in that period. The manager's name and tenure are disclosed on AMFI or AMC websites. If the manager has been in place for less than 3 years, the earlier record has limited predictive value. "House view" funds, where the whole team decides collectively, are less exposed to single-manager risk, and an index fund has no manager to evaluate at all — the process is the index, so there is zero key-person risk.
How to pick an index fund
In rough order of importance:
Tracking error. This is the annualised standard deviation of the difference between the fund's daily return and the index's daily return — a measure of how reliably the fund mirrors the index every single day, not just at the end of the year. A tracking error of 0.05% means the fund and index returns are nearly identical on most days; 0.5% means more daily variation, which can add up to meaningful underperformance or overperformance over a year. For Nifty 50 index funds, tracking error above 0.2–0.3% a year suggests the fund is not efficiently replicating the index; in well-established large-AUM funds, aim for below 0.15%. Causes include cash drag (holding cash for redemptions rather than being fully invested), delayed rebalancing when the index adds or removes a constituent, securities lending income (which partially offsets tracking error in some funds), and differences in dividend reinvestment timing.
For example, Fund A tracks Nifty 50 closely: in a year where Nifty 50 returns 14%, it returns approximately 13.85% (14% minus its 0.15% TER). Fund B has the same 0.15% TER but trails the index by a further 0.4% a year, a gap called tracking difference, so it might return 13.45%. Over 15 years, that 0.4% annual gap compounds into approximately ₹3.6 lakh on a ₹10 lakh investment — purely from tracking difference, not fees. Check tracking error on AMC fact sheets or mutual fund data platforms before choosing.
Total expense ratio. For Nifty 50 index funds, the range is roughly 0.05% to 0.20% in direct plans. Prefer the lower end; over 20 years, 0.1% makes a difference.
AUM (assets under management). Larger AUM generally gives the fund more liquidity to manage inflows and outflows smoothly, which reduces tracking error. Very small index funds (below ₹500-1000 crore) sometimes have slightly higher tracking errors due to operational constraints.
AMC track record. Stick with AMCs that have been managing index products for a meaningful period and have a stable fund operations history. This isn't a guarantee, but it reduces operational risk.
Star ratings on mutual fund comparison sites matter less than you think. Most rating methodologies are backward-looking and change frequently, and for index funds they are particularly irrelevant: a Nifty 50 index fund from AMC A and AMC B should deliver nearly identical returns. Check TER and tracking error instead.
Nifty 50, Nifty Next 50 and Nifty 500
| Index | What It Covers | Risk Level | Notes |
|---|---|---|---|
| Nifty 50 | Top 50 companies by market cap | Lower | Most liquid, most stable |
| Nifty Next 50 | Ranks 51-100 by market cap | Moderate-higher | Acts more like a large-mid blend; higher volatility |
| Nifty 500 | Top 500 companies | Moderate | Broader coverage; includes mid and small cap exposure |
| Nifty Midcap 150 | Mid-cap companies | Higher | More volatile; longer investment horizon needed |
The Nifty Next 50 has historically shown periods of meaningful outperformance over Nifty 50, and periods of underperformance. It is not a mid-cap index — these are large companies, just outside the top 50. Over long horizons, some investors combine Nifty 50 (70%) and Nifty Next 50 (30%) for broader large-cap coverage. There is no single "correct" choice: the differences in long-term returns between these indices tend to be smaller than the variation introduced by choosing between well-run index funds and underperforming active funds.
Deciding between index and active funds
Use index funds if:
- You want the simplest, lowest-maintenance equity strategy
- You're investing in large-cap equities
- You don't have time or interest in evaluating fund managers
- You want to minimise costs with certainty
Consider active funds if:
- You're allocating to mid-cap or small-cap where manager skill has more scope
- You have conviction (backed by research, not marketing) in a specific fund manager's long-term process
- You're willing to monitor the fund's manager stability and process adherence over time
Avoid active funds if:
- You're choosing them primarily based on recent 1-3 year performance
- You're in regular plans without a specific advisor adding clear value
- The expense ratio is above 1.5% and the fund has no strong differentiated process
The index vs active debate often gets framed as religion. It shouldn't be. It's a cost-benefit question, and for most retail investors in India investing in large-cap equities over long horizons, the calculus favours passive investing.
Debt mutual funds
For decades, the default place for an Indian family's safe money has been the fixed deposit. Debt mutual funds are the less-understood alternative, and after a major tax change in 2023 a lot of outdated advice about them is still floating around: some people now dismiss debt funds entirely, while others still recommend them for tax reasons that no longer apply.
What a debt fund holds
A debt mutual fund pools money from investors and lends it out by buying fixed-income securities — government bonds, corporate bonds, treasury bills, certificates of deposit, commercial paper, and similar instruments. Your return comes from the interest on these holdings plus any change in their market prices, which move with interest rates. That return is generally far less volatile than equity, but it is not guaranteed like a fixed deposit's.
| Category | Typical holding maturity | Interest-rate risk | Best suited for |
|---|---|---|---|
| Liquid fund | Up to 91 days | Very low | Parking money for days to a few months |
| Ultra-short duration | ~3-6 months | Low | Short-term goals, emergency-fund portion |
| Short duration | ~1-3 years | Moderate | 1-3 year goals |
| Corporate bond fund | Varies, high-rated paper | Moderate | Quality-focused medium-term holding |
| Gilt / long duration | Long (govt or long bonds) | High | Investors with a rate view and longer horizon |
| Credit-risk fund | Varies, lower-rated paper | Moderate + credit risk | Higher yield, higher default risk — for the informed only |
The single most important habit with debt funds is matching the fund's duration to your time horizon. Long-duration and gilt funds can lose value when interest rates rise, so they are not "safe parking" — they are an interest-rate bet. For most beginners parking short-term money, a liquid fund or an ultra-short-duration fund from a large, reputable AMC investing in high-quality paper is the safest starting point; avoid credit-risk and long-duration funds until you understand the specific risk you are taking.
Credit risk and interest-rate risk
An FD has essentially one risk: the bank failing. Debt funds have two:
- Credit risk — the chance that a bond issuer the fund lent to defaults or is downgraded. High-quality funds holding government and top-rated corporate paper carry little credit risk. Credit-risk funds, which deliberately hold lower-rated bonds to earn higher yield, carry a lot.
- Interest-rate risk — when market interest rates rise, the prices of existing bonds fall, and the fund's NAV dips. The effect is larger for longer-duration funds and smaller for short ones, which is why a gilt fund can post a negative month even though it holds only government bonds.
Neither risk makes debt funds bad; it makes them not FDs. A liquid fund from a large AMC holding high-quality short-term paper is about as close to FD-like stability as a debt fund gets — but it is still not insured or guaranteed, and even high-quality liquid and short-duration funds can have small dips.
How debt funds are taxed since April 2023
For a long time, debt funds enjoyed a big tax advantage: if held for over three years, gains were taxed as long-term capital gains with indexation, which adjusted your purchase price for inflation and often cut the effective tax to a few percent. FD interest, by contrast, is taxed at your full slab rate every year.
That advantage was removed. For debt funds purchased on or after 1 April 2023, gains are added to your income and taxed at your income slab rate, regardless of holding period. Any advice that sells debt funds primarily for the three-year indexation benefit is out of date for these investments. On the headline tax rate, a debt fund and an FD now sit in broadly the same place. (Tax rules change; verify the current position with a tax professional.)
The tax edge that remains is deferral. FD interest is taxed every year as it accrues, even if you don't withdraw it. A debt fund is taxed only when you redeem, so if you hold it for several years and sell once, you pay tax once, at the end, and the un-taxed amount compounds in the meantime. Debt funds no longer beat FDs on tax rate, but they can still win on tax timing.
Because debt-fund gains are taxed only on redemption and there is no annual TDS slip like FD interest, some investors forget to declare the gain in the year they sell. You must report it.
When debt funds beat FDs and when FDs win
Debt funds have the edge on:
- Liquidity without penalty. Break an FD early and you typically lose some interest as a penalty. Redeem most debt funds and you face only a small exit load (often only in the first few days for liquid funds, sometimes none).
- Goal-based investing. You can SIP into a debt fund, redeem partially, and align maturity to a goal far more flexibly than laddering a series of FDs.
- Returns when rates fall. Longer-duration debt funds can then earn capital gains on top of interest income and exceed FD returns — with the matching risk if rates rise instead.
- No reinvestment hassle. FDs mature and must be renewed, often at whatever rate prevails. A debt fund simply keeps running.
FDs have the edge on:
- Absolute certainty. If you need a guaranteed, known amount on a known date — a child's fee due next year, a planned purchase — an FD's contractual return removes all doubt. A debt fund's return is a reasonable expectation, not a promise.
- Deposit insurance. No debt fund carries the insurance that covers bank deposits up to ₹5 lakh per bank.
- Simplicity. For someone who finds NAVs, duration, and credit ratings confusing, an FD is honest about what it is. Complexity you don't understand is a risk in itself.
- Predictable income for senior citizens. Special senior-citizen FD rates plus the certainty of payouts often suit retirees who prioritise stability over optimisation.
You can compare an FD's maturity value for any rate and tenure — and stress-test how inflation erodes a fixed return over time — with the compound interest calculator.
A worked example: FD or debt fund for three years
Suppose you have ₹10 lakh to keep safe for 3 years, and you are in the 30% tax slab.
- FD route: at, say, 7% interest, the FD earns roughly ₹70,000 in year one — but that interest is taxed at 30% each year as it accrues, so your effective post-tax rate is about 4.9%. After 3 years, your post-tax corpus is roughly ₹11.55 lakh.
- Debt fund route: assume a high-quality short-duration fund returns a similar ~7% gross. No tax is deducted along the way, so after 3 years the pre-tax value is about ₹12.25 lakh, a gain of ₹2.25 lakh. You then pay tax at your 30% slab on the whole gain at redemption — about ₹67,500 — leaving roughly ₹11.58 lakh.
The two land close, because the headline tax rate is now the same. The debt fund's edge comes from deferral and liquidity: if you'd needed the money at month 14, the FD would have charged a premature-withdrawal penalty and the debt fund would not. The longer the horizon and the larger the corpus, the more the deferral advantage grows. This is why, for your safe allocation, debt funds sit naturally alongside FDs rather than replacing them — both are part of the debt side of your asset allocation, balancing the equity in your long-term SIPs.
Reading a debt fund factsheet
A debt fund's name tells you its category, but two numbers on the factsheet tell you its risk.
Average maturity (or Macaulay duration) measures how sensitive the fund is to interest-rate changes: the longer it is, the more the NAV will swing when rates move. A liquid fund's average maturity is measured in days; a gilt fund's can be many years. If you see a multi-year average maturity in a fund you're considering for a six-month goal, it's the wrong fund.
Credit quality, or rating profile, is the breakdown of holdings by credit rating. A fund dominated by sovereign (government) and AAA-rated paper carries low credit risk. A fund with a meaningful slice of AA, A, or unrated paper is reaching for yield by taking on default risk. There is nothing inherently wrong with that — but you should know you're taking it, and be paid enough extra yield to justify it. A debt fund quietly yielding 2-3% above peers is almost always doing so through lower credit quality.
In debt funds, an unusually high yield is not a free lunch — it is the market pricing in either interest-rate risk or credit risk. Understanding which one you're being paid for is the whole game.
Balanced advantage funds
Most investors know they should sell some equity when markets are euphoric and buy more when markets are fearful, and almost nobody actually does it — the emotions run the wrong way. A balanced advantage fund (BAF) is an attempt to outsource that discipline to a rules-based model so your own psychology never gets a vote. It is neither a miracle nor a gimmick: its job is to smooth the equity experience so cautious investors stay invested.
How a balanced advantage fund shifts between equity and debt
A balanced advantage fund, also called a dynamic asset allocation fund, is a hybrid mutual fund that continuously varies its split between equity and debt according to a predefined model, rather than holding a fixed ratio. In a valuation-based model the logic is contrarian by design: when signals such as price-to-earnings, price-to-book or proprietary valuation measures say markets are expensive, the fund reduces its net equity exposure and holds more in debt and arbitrage; when markets look cheap, it raises equity exposure to capture more of the expected recovery.
Net equity versus gross equity. A BAF often reports a high gross equity figure but a much lower net figure, because it uses derivatives (typically index futures) to hedge part of its equity holdings. A fund holding 65% in stocks with 25% of the portfolio hedged has net equity exposure of around 40%, while the hedged 25% behaves like low-risk arbitrage, earning a small, steady return regardless of market direction. This lets the fund dial true market risk up and down smoothly — and it is why a fund's net equity history, not its gross figure, shows how much real market risk it carries.
How balanced advantage funds are taxed
The hedge also keeps the equity-plus-arbitrage portion above the threshold that qualifies the fund for equity taxation, even when genuine market exposure is modest: debt-like risk on part of the money, equity-like tax treatment on the whole. For many investors, equity taxation is more favourable than the slab-rate taxation applied to debt funds.
Two caveats. The benefit depends on each fund maintaining the required structure — a feature of how the fund is run, not a law of nature. And tax rules for fund categories have changed in recent years and can change again. Treat "taxed as equity" as the typical case to verify: check the specific fund's stated tax status and confirm the current rules with a tax professional.
The trade-off: a smoother ride and a lower peak
| Market condition | Pure equity fund | Balanced advantage fund |
|---|---|---|
| Strong bull market | Captures full upside | Lags — equity was trimmed near highs |
| Sharp crash | Falls hard | Falls less — equity was already reduced |
| Sideways / choppy | Flat, volatile | Often steadier, arbitrage adds a little |
| Investor behaviour | Tempted to panic-sell | Easier to stay invested |
A BAF cannot fully cushion the falls and still capture the rises: in roaring bull runs it typically underperforms a pure equity fund because it pared back equity as valuations climbed, and in crashes it typically outperforms because it entered the fall with less equity. Over a full cycle the appeal is a smoother path to a reasonable return, not a higher one — and a fund that returns slightly less but that you actually hold through a downturn beats a higher-returning fund you panic-sell at the bottom.
Imagine ₹10,00,000 invested at the start of a tough two-year stretch — a sharp fall followed by a partial recovery. These are illustrative numbers chosen to show the mechanism, not a prediction.
| Pure equity fund | Balanced advantage fund | |
|---|---|---|
| Starting value | ₹10,00,000 | ₹10,00,000 |
| Year 1: market falls ~30% | ₹7,00,000 (−30%) | ₹8,20,000 (−18%, less equity) |
| Year 2: market recovers ~20% | ₹8,40,000 | ₹9,02,000 |
| Net change over 2 years | −16% | −9.8% |
The BAF ends the rough patch with noticeably more capital because it fell less in year one. The flip side is that in a year where the market rose 30%, the pure equity fund would have pulled meaningfully ahead. A compound interest calculator helps build intuition for how much the depth of a fall matters to the eventual recovery.
Smoother is not the same as safe. A BAF is not capital-protected: it still holds meaningful equity and can fall when markets fall, just usually by less, and its debt portion carries its own interest-rate and credit considerations. Do not park money you need next year in one.
Not every balanced advantage fund uses the same model
The category is defined by its flexibility to move between equity and debt, but each fund house decides how to move. Valuation-based models lean counter-cyclical: they raise equity when markets look cheap on measures like price-to-earnings or price-to-book and cut it when markets look expensive, can swing net equity over a wide range, and tend to be the more genuinely contrarian. Trend or momentum-based models do something closer to the opposite, adding equity as markets rise and trimming it as they fall. A third group blends both signals.
Two funds with the same label can therefore behave very differently in the same market: at a peak, a valuation-based fund may already have cut equity sharply while a momentum-based fund is still heavily invested. Neither approach is "correct" — they suit different market environments — but the model determines how much downside protection you are actually buying, so read the scheme's stated asset-allocation model in its documents. It is also why comparing BAFs purely on past returns misleads: a recent chart-topper may simply have had the model that suited the recent market. Judge the approach and its consistency across at least one full market cycle.
A balanced advantage fund or an index fund plus debt
You can get most of the way to a BAF yourself, at lower cost. Holding, say, 60% in an equity index fund and 40% in debt, and rebalancing once a year back to that split, is a simpler version of what a BAF does — trimming equity after it runs up, adding after it falls — and index funds carry lower expense ratios than actively managed BAFs.
A BAF adds two things. It adjusts continuously using a model, not once a year, and can use derivatives to fine-tune net equity in ways a retail investor cannot. More importantly for many people, it removes the behavioural risk: the DIY rebalancer has to actually press "sell equity" in a euphoric bull run and "buy equity" in a frightening crash, precisely when emotions scream the opposite.
So the choice often comes down to temperament. If you will reliably rebalance on schedule, the cheaper route — an index fund plus debt, covered in our index fund portfolio guide — may serve you better. If you suspect you will hesitate or panic, paying a little more for a BAF that enforces the discipline can be money well spent.
Where a balanced advantage fund fits
- A single-fund core for cautious or new investors who want one diversified holding without managing an equity-debt split themselves. It is a gentler introduction than a pure equity fund, consistent with our mutual funds for beginners guide.
- A medium-term goal vehicle for goals roughly five to eight years away, where you want growth but cannot afford a deep drawdown right before you need the money — the steadier home for medium-horizon money described in our SIP strategy note.
- A volatility-reducer within a larger portfolio, as the calmer portion alongside pure equity index funds and debt.
A BAF is not a replacement for your overall asset allocation. It manages its own mix but cannot know how much of your total wealth should be in equity versus debt versus other assets; a net worth tracker is the place to see whether your overall risk level makes sense.
Arbitrage funds
Arbitrage funds behave like a low-risk, debt-like product, yet for tax purposes they are treated as equity funds. Almost nobody understands how they actually earn their return, which leads to both unrealistic expectations and missed opportunities.
How arbitrage funds earn their return
Arbitrage is profiting from a price difference for the same asset in two markets, with no directional bet. For these funds, the two markets are the cash (spot) market and the futures (derivatives) market for the same stock. The futures price usually sits a little above the cash price, reflecting the cost of carrying the position to the contract's expiry. The fund simultaneously buys the stock in the cash market at the lower price and sells the equivalent futures contract at the higher price.
The position is fully hedged: a rise in the share is offset by a loss on the short futures, and vice versa. At expiry the cash and futures prices converge, and the fund pockets the original gap. That gap, repeated across hundreds of positions and rolled over each expiry, is the source of return.
An arbitrage fund's portfolio is not a list of "good stocks." It has three layers:
- The hedged equity book — matched cash-market holdings and short futures positions, usually in large, liquid names where the futures market is deep enough to enter and exit cleanly. The fund cares about the spread and the liquidity, not whether the companies are "good" in a long-term sense.
- The debt and money-market sleeve — the money not deployed in live arbitrage, held in very short-term, high-quality debt and money-market instruments for a small steady yield. In quiet markets, when arbitrage opportunities are thin, this sleeve carries more of the return.
- Cash and margin — held as margin for the futures positions and as working cash for rolling contracts at each expiry.
That blend of harvested spreads and short-term debt yield is why the fund lands in the low-risk, modest-return zone rather than swinging with the equity market. Scale and a capable dealing desk help a larger, well-run arbitrage fund capture spreads efficiently, which can make it steadier.
Why arbitrage funds are low-risk
Because every equity position is hedged, the fund's net exposure to market direction is close to zero, so a crash does not gut it the way it would a normal equity fund. Over any reasonable holding period of a few months, the probability of losing capital is low. Arbitrage funds are not as instantly liquid or as utterly stable as a savings account, and there is a small element of execution and liquidity risk, but they are a long way from the volatility of a directional equity fund.
What varies is the return. It depends on how wide and frequent cash-futures spreads are, which in turn depends on market volatility and demand for leverage. In volatile, active markets, spreads widen and roll-over opportunities are plentiful, so returns improve; in calm, low-volatility markets, spreads compress and returns can dip below those of a plain liquid fund. Never extrapolate a recent strong patch — set expectations against the prevailing volatility environment, not last quarter's numbers. An arbitrage fund is a low-risk, tax-efficient parking option, not a high-return or guaranteed one.
How arbitrage funds are taxed
Indian tax law classifies a mutual fund as equity-oriented if it keeps a sufficiently high proportion of its assets in domestic equities. An arbitrage fund's cash-market leg counts as that equity holding even though it is hedged, so the fund qualifies as equity-oriented despite carrying debt-like risk:
- Long-term capital gains (units held more than 12 months) are taxed at the equity LTCG rate, with the annual exemption threshold on gains, rather than at your income slab.
- Short-term capital gains (held 12 months or less) are taxed at the equity STCG rate.
Gains on a liquid or debt fund, by contrast, are added to your income and taxed at your slab rate, which can be 30% plus surcharge for high earners. Tax rates and thresholds change, so confirm the current equity LTCG and STCG rates before relying on specific figures; the durable point is equity treatment on a low-risk product.
Arbitrage funds compared with liquid funds and FDs
| Feature | Arbitrage Fund | Liquid Fund | Short-term FD |
|---|---|---|---|
| Source of return | Cash-futures spread | Short-term debt interest | Fixed deposit rate |
| Risk level | Low | Low | Very low (insured to ₹5L/bank) |
| Return character | Modest, varies with volatility | Modest, stable | Fixed, known upfront |
| Tax treatment | Equity (favourable) | Slab rate | Slab rate |
| Liquidity | 1-3 business days | Same/next day | Lock-in; penalty on early exit |
| Best for | 3 months to 2 years, high tax bracket | Days to a few months | Fixed short tenure, certainty |
On pre-tax returns, all three are broadly in the same neighbourhood; the differentiator is tax. For a high-bracket investor with a horizon beyond a year, the arbitrage fund's equity taxation tilts the after-tax outcome in its favour. For very short parking or someone in a low tax slab, liquid funds and FDs are simpler and the tax edge largely disappears.
Who should use an arbitrage fund
Arbitrage funds suit high-tax-bracket investors parking money for several months to two years — say, a lump sum needed in 8–18 months for a future home down-payment, a planned large purchase, or a surplus not yet allocated — and conservative investors who want a low-volatility holding but dislike the slab-rate taxation of debt funds.
They are also a disciplined way to stage a lump sum into equity. If you are nervous about deploying a large amount all at once, park it in an arbitrage fund and set up a Systematic Transfer Plan (STP) that moves a fixed amount into an equity fund each month; the waiting money earns a tax-efficient return while it is fed gradually into the market. The deployment-timing question is explored in Lump Sum vs SIP: Does Timing the Market Beat Averaging?.
They are a poor fit for investors in the lowest tax slabs, for whom the equity-tax advantage is small; for money needed within days or a couple of weeks, where the slightly slower redemption (typically T+1 to T+3) and variable return make a liquid fund or savings account simpler; and for growth. Arbitrage funds are a parking tool, not a wealth-creation engine — for growth, see Mutual Funds for Beginners and SIP in Mutual Funds.
A worked example: parking a bonus for 14 months
Suppose Anil receives a bonus of ₹10 lakh in April and will need it for a property purchase 14 months later. He is in the 30% tax bracket.
- Option A — liquid fund. Assume a pre-tax return of, say, 6.5% over the period. As a debt fund, the gain is taxed at his 30% slab, so he loses about 30% of it to tax.
- Option B — arbitrage fund. Assume a broadly similar pre-tax return. Because he holds for more than 12 months, the gain qualifies for equity LTCG treatment, taxed at the lower equity rate with an annual exemption on gains, so his after-tax retention is meaningfully higher even if the pre-tax return is identical.
Arbitrage funds may not earn more pre-tax; the same return is simply worth more after tax to a high-bracket investor with a 12-month-plus horizon. Plug your own amount and assumed rate into the lumpsum and compound interest calculators to see the gap for your bracket; the figures depend on prevailing returns and tax rates, so treat this example as illustrative.
Exit loads and expense ratios on arbitrage funds
Some arbitrage funds charge a small exit load if you redeem within a short initial window (often 15–30 days), and redeeming too soon can wipe out the modest return, so check the exit-load structure before investing. Because returns are modest, the expense ratio also eats a proportionally larger share than it would in a high-return equity fund. Compare expense ratios across a few arbitrage funds and prefer the direct plan to keep more of the thin spread; see Direct vs Regular Mutual Funds.
Matching a fund type to your goal and time horizon
The single best filter is your time horizon — when you'll need the money. The longer your horizon, the more volatility you can convert into return. The shorter it is, the more you should prize stability. This is why retirement money decades away can hold small-caps, while money for a goal three years out should not.
| When you need the money | Fund types that fit | Keep out |
|---|---|---|
| Days to a few months | Liquid fund, or a savings account for money needed within days | Arbitrage funds, which need at least a few months: T+1 to T+3 redemption and exit loads in the first weeks |
| 3 months to 2 years | Ultra-short duration fund for short-term goals; arbitrage fund if you are in a high tax bracket | Long-duration and gilt funds |
| 1-3 years | Short-duration debt fund; an FD if you need a known amount on a known date | Equity funds of any market cap |
| 3-7 years | Large-cap and flexi-cap funds | Heavy small-cap exposure |
| Roughly 5-8 years | Balanced advantage fund | — |
| 7-10+ years | Meaningful mid and small-cap exposure | — |
An arbitrage fund is taxed as equity but fully hedged, so it is not the directional equity exposure the under-three-years rule is about. Under three years, small-caps especially can be deeply underwater, and between three and seven years a crash near your goal date can be devastating with no time to recover.
Emergency money. Debt funds and FDs can both work for an emergency fund, and many people split it. A liquid fund offers quick access (often next-day redemption, with an instant-redemption option up to a limit) and no premature-withdrawal penalty; an FD or sweep-in account is simpler and fully predictable. A common approach is to keep one part in a savings or sweep account for instant access and the rest in a liquid fund.
Building the equity part of a portfolio
For a single fund, a flexi-cap fund covers all three market caps, and a balanced advantage fund suits you if the swings of pure equity are uncomfortable. For someone starting out, a Nifty 50 index fund is a defensible core.
For most Indian retail investors building a core equity portfolio, a simple core-satellite structure works:
- Core (70–80% of equity allocation): a Nifty 50 index fund or Nifty 100 index fund in direct plan. Low TER, negligible tracking error, fully passive.
- Satellite (20–30% of equity allocation): one mid-cap allocation — either a Nifty Midcap 150 index fund (fully passive) or a well-established active mid-cap fund that clears the selection bar for active funds.
This gives you the cost certainty of passive investing for the majority of your equity allocation while allowing a limited active bet where the case for manager skill has more support. More complexity than this — multiple thematic funds, international funds, small-cap allocations — is for investors who have already established a core. Beginners building their first portfolio are better served by simplicity; the 15-year equity mix shows what a larger small-cap slice looks like once you have a long horizon and a moderate-to-high risk appetite.
Putting it into practice
- Fix the purpose and time horizon of the money first. It is the single biggest determinant of which fund type fits and how much mid and small-cap exposure is appropriate.
- Decide your overall equity-versus-debt split as part of your asset allocation, then choose funds for each side. A balanced advantage fund sits within that plan rather than replacing it.
- Be honest about the fall you can sit through. Weigh return potential against the depth of fall you can tolerate without selling, and keep small-cap exposure a controlled portion, funded with money not needed for 7-10 years.
- Keep the number of funds small. Holding five funds that all own the same top large-caps gives you complexity without extra diversification, and owning a balanced advantage fund and an aggressive hybrid and several equity funds often just reproduces a muddled equity-debt mix. Decide the role each fund plays and avoid stacking near-duplicates.
- Use direct plans and check costs. For index funds, compare tracking error and TER; for arbitrage funds, compare expense ratios and check the exit load.
- Keep investing through falls and review once a year. Many long-term investors continue SIPs through crashes — that is when the aggressive sleeves tend to do their best long-term work. Each sleeve can be modelled in the SIP calculator and the total checked against your target using the goal calculator, and reviewing your holdings once a year inside your net worth tracker helps you stay on top of them.
- Verify before you invest. Fund names, TERs and category rankings shift over time, and SEBI fund-category definitions and tax rules are periodically revised. Confirm the current numbers on AMFI or the AMC's own factsheet and the rules on the official SEBI and AMFI sites — what's cited here is a snapshot, not a live feed.
- Get advice for decisions specific to your finances. A SEBI-registered investment adviser, or a tax professional for the tax side, can weigh your specific situation.
Related calculatorinvestment calculator
Frequently Asked Questions
Sources and references
- Association of Mutual Funds in India (AMFI)
- Securities and Exchange Board of India (SEBI)
- Income Tax Department, Government of India
Rules, rates, and thresholds in India change over time. Always confirm the current position with the official source above before acting on it.